2.5 quintillion bytes of data are produced everyday, transforming it into a visual format that is easy to understand is key to an effective presentation of critical information. Through visualization, text-based data sets that are otherwise hard to interpret are presented in easy to read fashion. But how do you choose the right type of graph that will help you achieve a compelling presentation? This five-minute read has all the tips you need to choose the right option for your data set.
WHAT IS DATA VISUALIZATION?
Simply put, data visualization is the technique used to transform a raw data set into graphical values to make the information easier to understand and action on.
Graphs, charts, figures, and maps are just some of the ways of displaying data. Through visualization, readers can easily recognize any trends, parameters, or patterns. Human beings perceive the information presented on a visual or imagery form in a better way compared to plain text data. Hence, it’s a desirable and effective way to engage your audience and convey your message.
CHOOSING THE BEST GRAPH TYPE TO VISUALIZE YOUR DATA SET
Remember that 2.5 quintillion figure we started with? Companies that aren’t using data to stay competitive are getting left behind. As such, data doesn’t just allow you to make better decisions, it allows you to make faster decisions.
To pick the right type of graphical visualization, you must consider the type of data set you have. A well designed graph can convey the strongest points that best highlight your information.
Below are types of commonly used visuals and the scenarios in which they are most applicable:

1. Line graph
Line graphs are designed to display minor changes in a particular variable over a specified period. They are an excellent way to display the progress of information and compare changes in one data trend relative to the other. Unlike bar graphs, tracking small changes in your data is better indicated in a line graph. The stock market was built on the line graph, tracking minuscule changes, sometimes by the second.

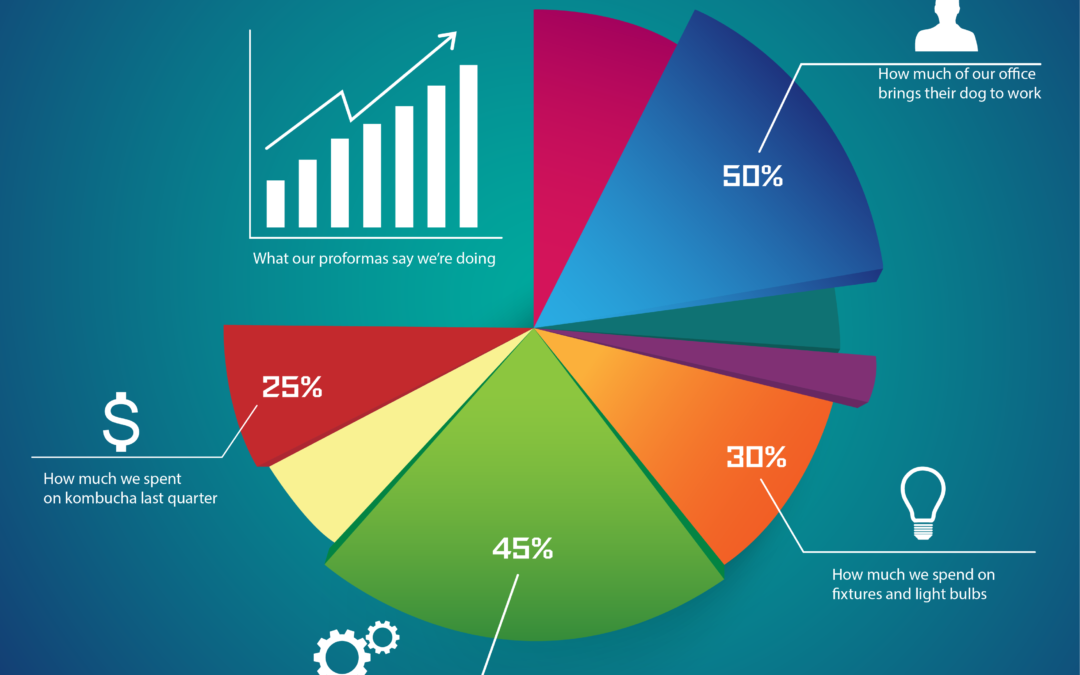
2. PIE CHART
This type of data visualization seeks to present relative parts of data on a pie slice. Each slice represents a proportion of the aggregate data. This allows you to compare different segments of your information and visually indicate the values that fit in each category. Pie charts are especially helpful when measuring data that can be considered part of a larger group. For example, total marketing dollars spent per category (marketing spend being the category), number of clients in each state (number of clients being the category), total revenue by location (revenue being the category).

3. BAR GRAPH
Like line graphs, this chart is used to track the changes in amounts or figures in data set for a duration of time. Unlike other visualizations, bar charts have the ability to compare a number of different categories at the same time. Tracking changes over time, or comparing/contrasting categories are great ways to use this versatile visual.

4. AREA GRAPH
Although they are similar to line graphs, they are more effective in showing the changes in two or more categories that fall under a single group. This makes it easier to track the variation in particular groups relative to each other as well as the overall performance of the category at the same time.

5. COMBO CHART
A combo chart uses two graphs to present multiple variables in the same layout. An example can be the fusion of a line and bar graph. This type of hybrid graphical representation is appropriate when you have two series of data with varying degrees of measurement that can only be indicated in different formats.

6. HISTOGRAM
Similar to a bar graph, a histogram is precisely vital while working with numerical variables. This visual data presentation groups data into several categories or “buckets” to show the frequency of data over a certain interval.

7. SCATTERPLOT
Scatterplots borrow an element of line graphs in that plots on an axis highlight trends in statistical data. If there is a bit of randomness in a data set, scatterplots are a great tool for displaying trends, while visually accounting for deviations from the norm. Similarities of different variables can be tracked, so the reader can easily understand the relationship between two sets of variables.
HELIOS CAN HELP WITH YOUR DATA STRATEGY
Depending on what you strive to achieve with your data, the above graphs can be a sure way to present your data. If you need help understanding how data influences your business strategy, Helios can help. Our analytics and dashboard systems are designed with clarity and user interaction in mind. Want to find out more? Click here to learn how we help businesses make data-driven decisions!


Recent Comments