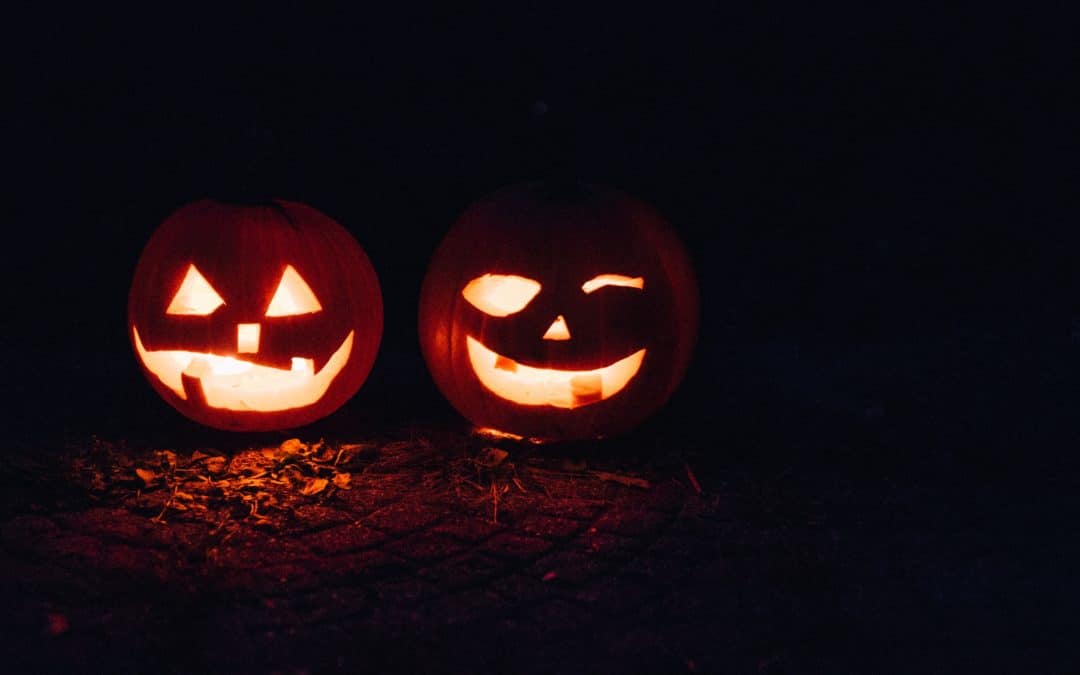
The number 13 has often been associated with bad luck but it’s no more unfortunate than any other figure. Since Halloween falls on the 31st, it’s an unusual transposition of this number but that may change if some people get their way. Petitioners are proposing the date be changed to be the last Saturday in October, similar to Thanksgiving falling on the final Thursday of the month.
Halloween purists disagree and would rather the date remain the same. In this light, what are some other fun facts and stats about one of the most beloved holidays for children and adults of all ages? Here’s a baker’s dozen of these trivial tidbits to get our mouths watering in anticipation of the arrival of All Hallow’s Eve along with all the sweets and treats associated with this date.
1. HOLY ROOTS
The term All Hallow’s Eve is the traditional title for Halloween marking the evening before the celebration of All Saints Day. It grew from the ancient Gaelic festival known as Samhain meaning Summer’s End or the beginning of harvest season.
2. RECORD-SETTING SPENDING
In 2018, retail spending for Halloween was estimated at $9 billion which was slightly less than 2017’s record-setting $9.1 billion spent. That’s an average of over $86 per person of around 175 million people celebrating this favorite fall holiday.
3. BREAKDOWN THE BUCKS
Of the billions spent in preparation for the arrival of All Hallow’s Eve, the least amount of cash is allocated on sweets and treats. When you look at the breakdown of how the bucks are divided, shoppers purchase:
- $2.6 million in candy which makes up for around 90% of American consumers
- $2.7 million of Halloween decor by nearly 75% of people
4. COSTLY COSTUMES
The most expensive part of this holiday is the cost of costumes when almost 70% of American customers shell out $3.2 billion on these outfits. More people, especially millennials are purchasing costumes for their pets with about 20% of them doing so and that’s up from 16% in 2017.
5. TOP 5 FAVORITES
The most popular costumes for pets are a pumpkin, hot dog, bumblebee, devil and dogs dressing up as their feline counterparts. Human adults prefer to disguise themselves as a witch, vampire, zombie, pirate or as a character from the popular Avengers franchise. The top five choices for children are a princess, superhero, Batman, a Star Wars character or a witch.
6. CANDY CRAVINGS
Among those with a sweet tooth, statistics share the most beloved treats received on Halloween are Reese’s Peanut Butter cups, Snickers, Twix, Kit Kat, Nerds, Sour Patch Kids and Skittles.
7. MOST LOATHED TREATS
Alternatively, the candies on the bottom of the trick-or-treat bag that people dislike the most include Circus Peanuts, candy corn, wax coke bottles, Necco Wafers, Mary Janes, Tootsie Rolls, Smarties, black licorice and Good & Plenty.
8. STATS ON JACK-O-LANTERNS
More statistics reveal top pumpkin growers in the United States include Illinois, California, Ohio, New York, Pennsylvania and Michigan producing more than 1.3 billion pounds of these gourds.
9. LONGEST HAUNTED HALL
Located 80 feet below the ground in an abandoned mine, the Haunted Cave in Lewisburg, Ohio measures 3,564 feet in length garnering a slot in the Guinness Book of World Records.
10. BLACK CATS
Often seen as a symbol of Halloween, black cats have plenty of fun facts and stats associated with these dark felines. They’ve been tied to many superstitious beliefs, associated with witchcraft, considered bad luck, revered as gods by ancient Egyptians and are:
- Actually considered to be good luck by many cultures
- Statistically more are male rather than female
- More than just a color since there are 19 different breeds of these felines
11. SECOND TO ONE
All things combined, with sales of costumes, treats, decorations and more, the only holiday to outsell Halloween in terms of pure dollars spent is Christmas.
12. HALLOWEEN TRUMPS VALENTINE’S DAY
Valentine’s Day once ruled the candy roost in purchases, but Halloween surpassed the sales of since more than twice as much chocolate is sold in the last part of October compared to the beginning of February.
13. RELATIVE TO BLACK FRIDAY
As many retailers are aware, a month after Halloween, Black Friday kicks off retail spending and sets the tone for who will get out of the red prior to the holidays. However, 40% of shoppers begin making their holiday purchases prior to October 31st.
In conclusion, when data and statistics are vital to your business, contact the professionals at Helios to take the fright out of these figures. There are no tricks to our services and we’ll deliver the data analysis that will treat your business to more success. On an ending note, here’s wishing you and yours a very safe and Happy Halloween!


Recent Comments