Recently we had a close call when the available disk space on one of our Sol Analytica hosted Tableau server approached zero. Luckily, and thanks to our monitors, we had zero loss of data and were able to have everything back to normal quickly. In this blog installment, we will discuss new log considerations to take into account for anyone upgrading their Tableau Server to 2023.1.1
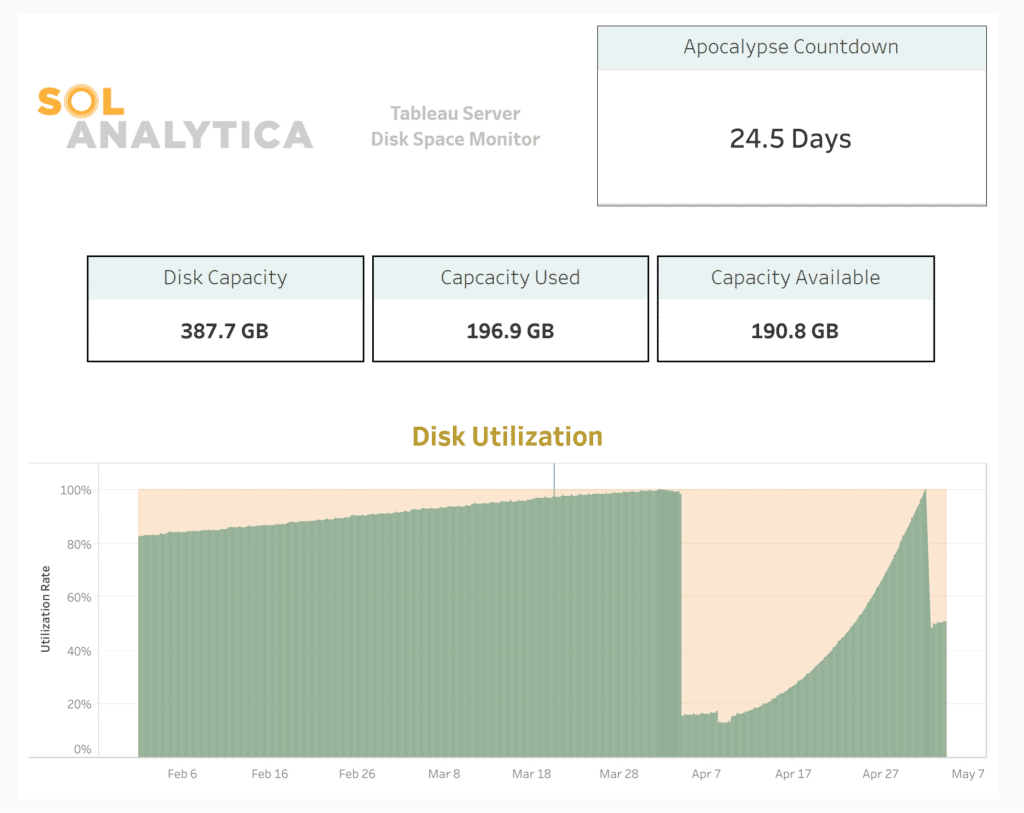
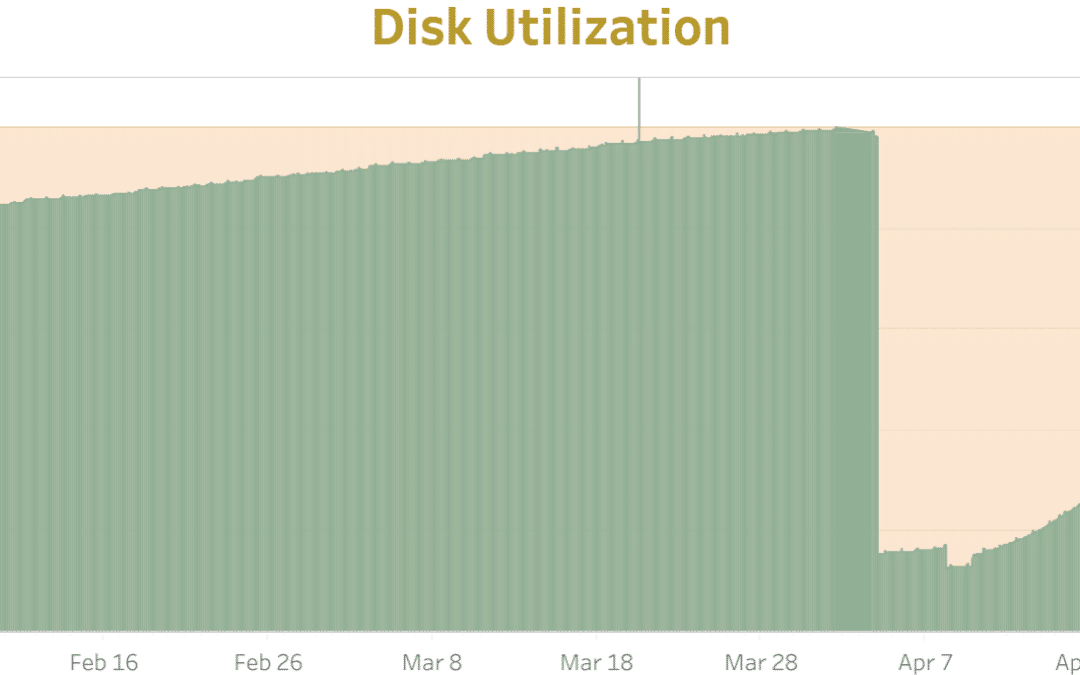
In the snapshot of our disk space monitoring dashboard from the server in question, notice the steady increase in usage from February through the beginning of April. This was our baseline expectation for disk space consumption and log growth for servers on version 2022.3.
On April 1 we performed maintenance, freeing disk space with a cleanup logs, while simultaneously migrating to version 2023.1.1.

Server admins who have been through a crash and recovery due to disk space will know why we called the metric in the upped right “Apocalypse Countdown!” After the upgrade, around April 7, the dashboard showed 14 months of leeway before we’d have to think about disk space again. That calculation was only valid for about 3 days – just long enough for us to stop paying close attention. The disk space usage went exponential and our days to apocalypse measure cratered. The server gave it’s first warning email on April 27 and was critical by mid-day April 28.
Should you run out of disk space, we hope the results of our RCA help you. Whether by avoiding a similar situation or coming to resolution quickly..
Investigating Disk Space Utilization
There are a relatively few processes that consume storage on a Tableau Server. Generally, the .hyper file format is compact, but it’s still possible to end up with lots of copies of big data sources if you aren’t careful. But the primary place to look for disk space consumption is the log files.
For our investigation, we ran an archive zip maintenance script and downloaded the files to a non-production machine where we could more easily analyze them. We used the FolderSizes tool to build a tree map of the disk utilization in the logs. It was immediately obvious that the ContentExploration logs were the primary source of growth.

When exponential growth peaked, this service was generating 13gb of log file per day. This seemed like a lot of log for the service that enables the search box. So we took a look at what was in those log files:

Yes, you read that right! The content Exploration Service was generating between 25 and 50 lines of log file per millisecond. Further, the amount of logs entries generated per millisecond was increasing consistently since we performed the upgrade.
With this info, we submitted a ticket via the Tableau Customer Portal, and after some research from the team the answer was “The huge size of contentexploration logs which is expected after upgrading the Tableau server.”
Resolution – Containing log file growth
To address this issue, there are two standard approaches of containing the log growth.
First, build a regular maintenance cleanup plan. This is a good practice and you should be doing regular log maintenance on your tableau server anyway. This involves a simple bash script that runs a maintenance command on a schedule. Note, if you need access to your logs for audit or compliance purposes, you will also need to archive and store off the logfiles. Here’s a command that will trim the logs and retain only the last 7 days.
tsm maintenance cleanup -l --log-files-retention 7Fun story: The first time our CEO ran a logs cleaning script on a tableau server, disk usage went from 1.7TB to 50Gb, that’s a lot of savings!
The second option is to turn down logging for this particular service. Most services now have an option to switch from full logging to only “info” or “error,” some of them can even be run without a TSM restart. This is now the recommended patch suggested by Tableau Customer Support. We took this approach. Once the data matures, we will update this post with the new log growth profiles.
Feel free to reach out with any questions, or begin a conversation with our data driven member of the Sol Analytica team. May data improve your day!


Recent Comments